Gnuplot. What is it?
Gnuplot is an open-source graphing system, which can be used with any programming language. It is extremely versatile, stable, scalable to large projects.
How can we use Gnuplot with Julia
Using the Gaston.jl library, which provides an interface to Gnuplot.
Installing Gnuplot
If you don’t have the Gnuplot already installed on your computer, the Gaston library won’t install correctly. I found it out the hard way after installing Gaston first (don’t do this!) with:
julia> ] add Gastonand then testing it with:
julia> ] test GastonThis gave me an error:

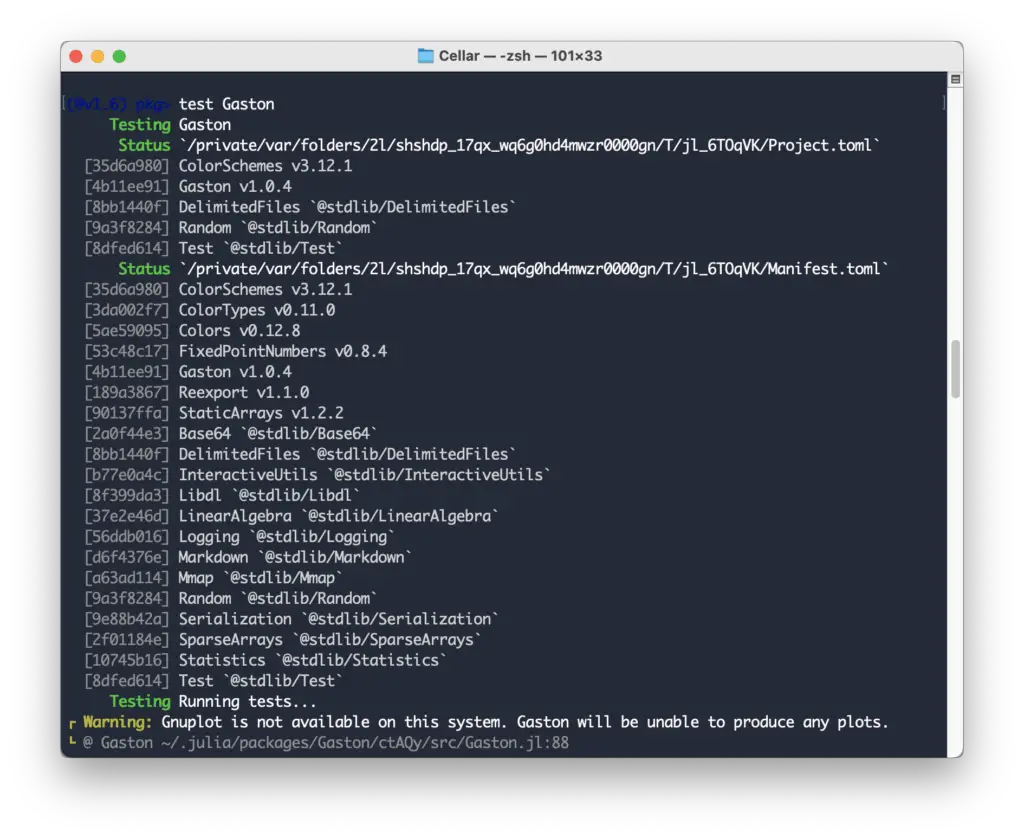
After some search, I realized that I should have installed the Gnuplot first. This is how I did it. From the terminal window ( make sure you are not in Julia REPL) I ran (on my MacBook M1):
brew install gnuplotThat took a while to install ( about 10 min).
Once that was done, I went on to customize the appearance of the plots with the minimum recommended configuration settings found in Gaston.jl documentation. However, it took me a while to find the configuration file for Gnuplot. Here is how I eventually found it.
In the terminal type:
brew info gnuplotto find the directory, where this configuration file is located.
The result:

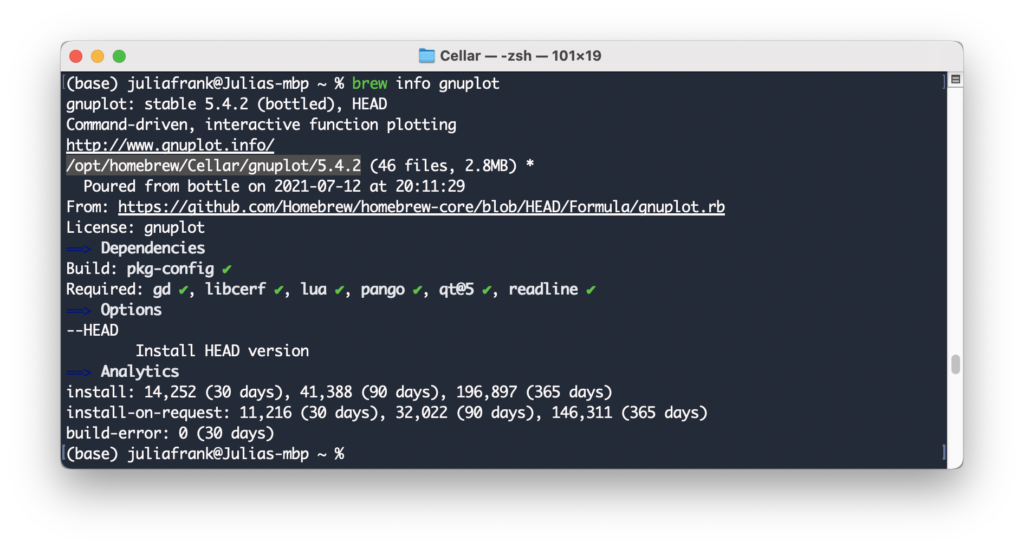
Now I know, that the directory is :/opt/homebrew/Cellar/gnuplot/5.4.2.
I cd into that directory from the terminal and created (as there was none) the config file using nano built-in text editor:

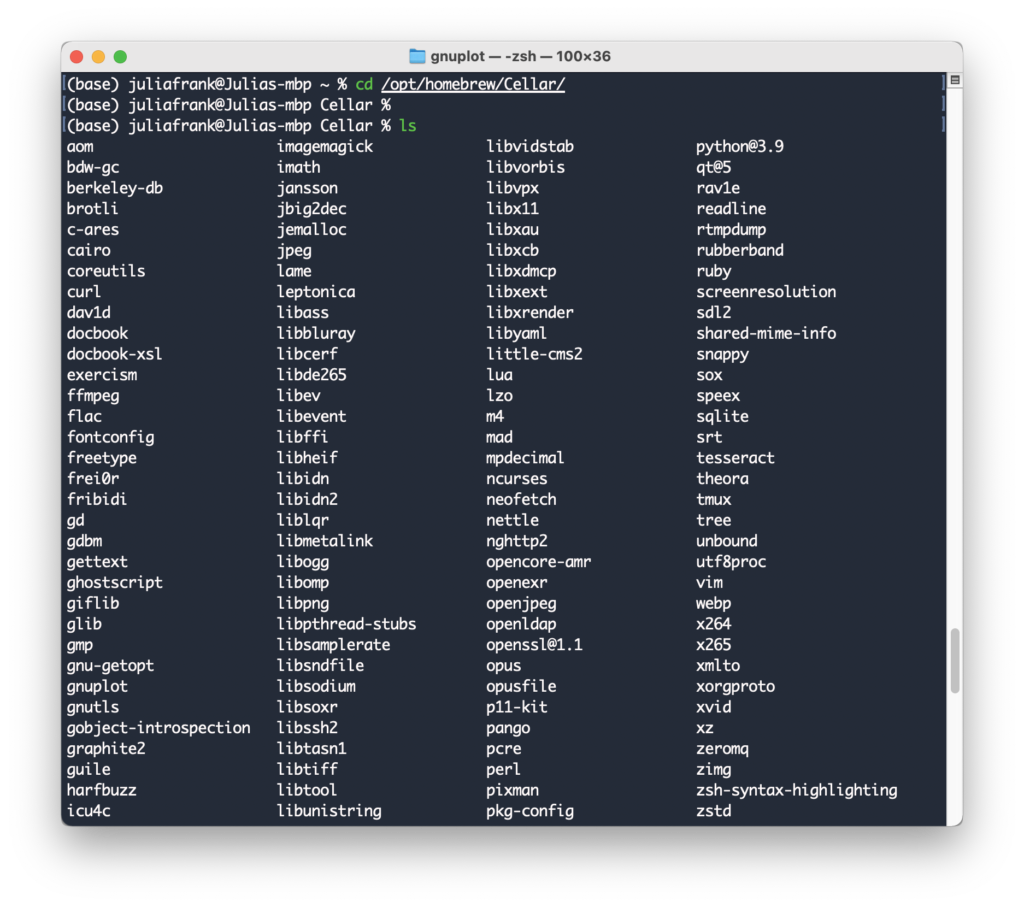
You can see the gnuplot in this list. It is a directory actually, not a .gnuplot config file. Let’s see what this directory contains ( with the ls command). It has only the start-up file for this version of Gnuplot 5.4.2. We can add a configuration gnuplot file to this directory by using the built-in nano text editor in the terminal.
nano gnuplot
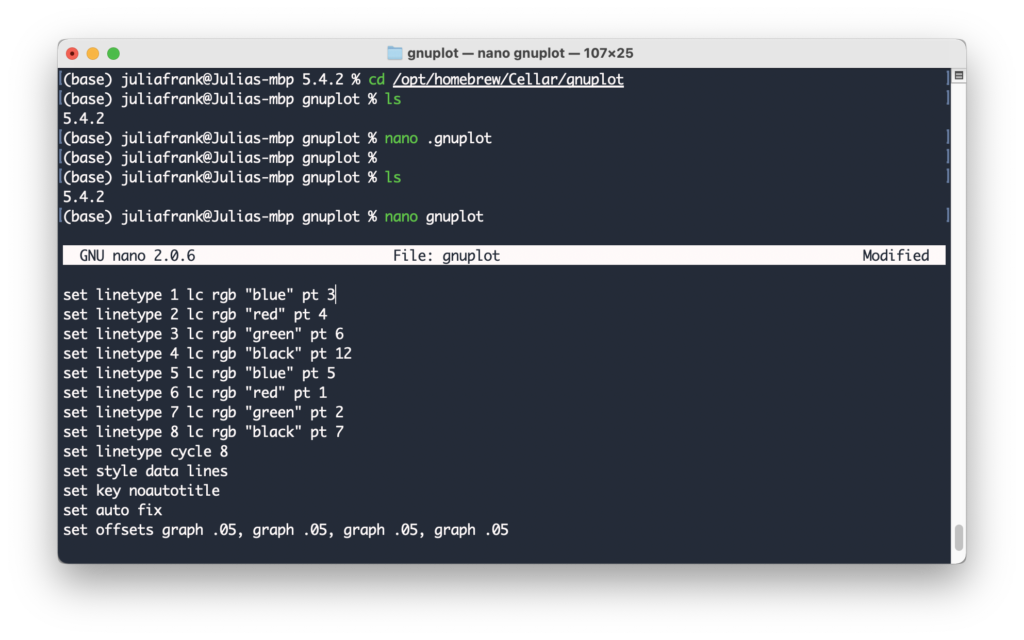
Nano creates the new file in this directory. Initially, it opens up as an empty file, into which we can paste our customization configurations, as you see in the above screenshot.
Saving it with Ctrl+X and Y, which brings you back to the terminal. That’s it. You are done customizing your Gnuplot setup for Julia. Let’s check the directory contents:

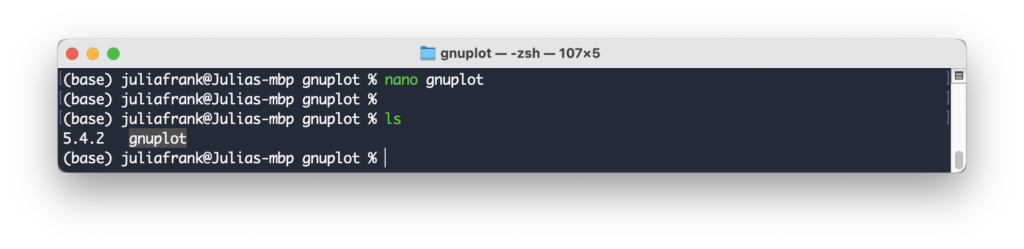
It now contains the executable and the gnuplot config file.
BTW, I found this interesting blog post/blog about further customizing options for Gnuplot.
Installing Gaston.jl
Now you can proceed to install the Gaston.jl. In the Julia REPL type:
julia> ] add Gaston

julia> ] test Gaston
This time it should install correctly and not raise any errors. Easy enough.
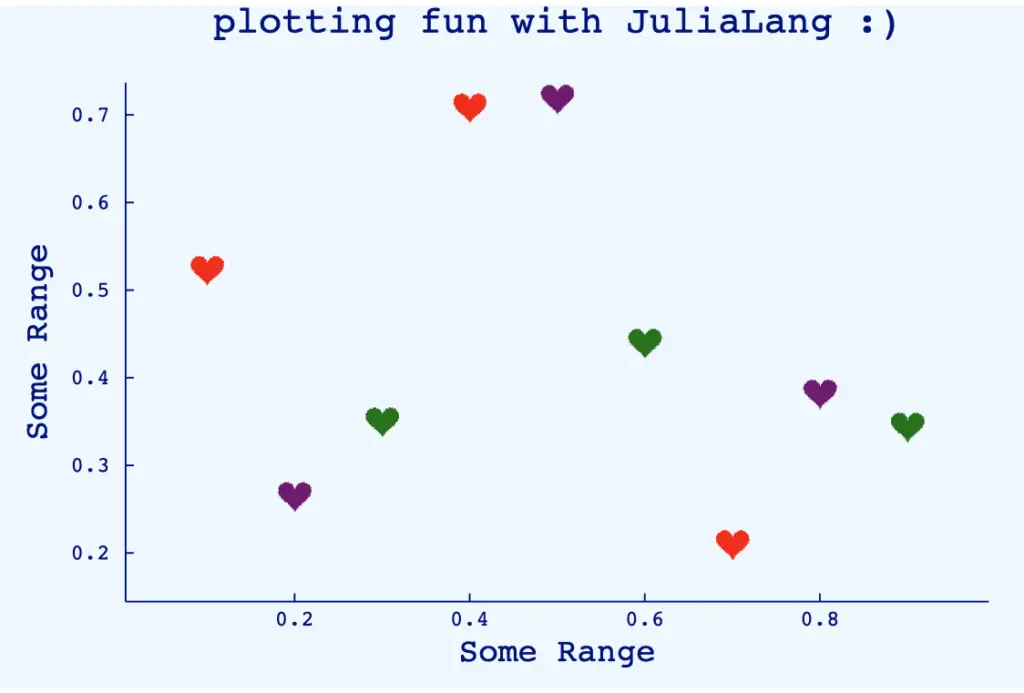
Testing Gaston plots
I tried testing if the Gaston package works by running the following in the Jupyter notebook.
using Gaston

plot(1:10, Axes(title = "'A simple plot'"))
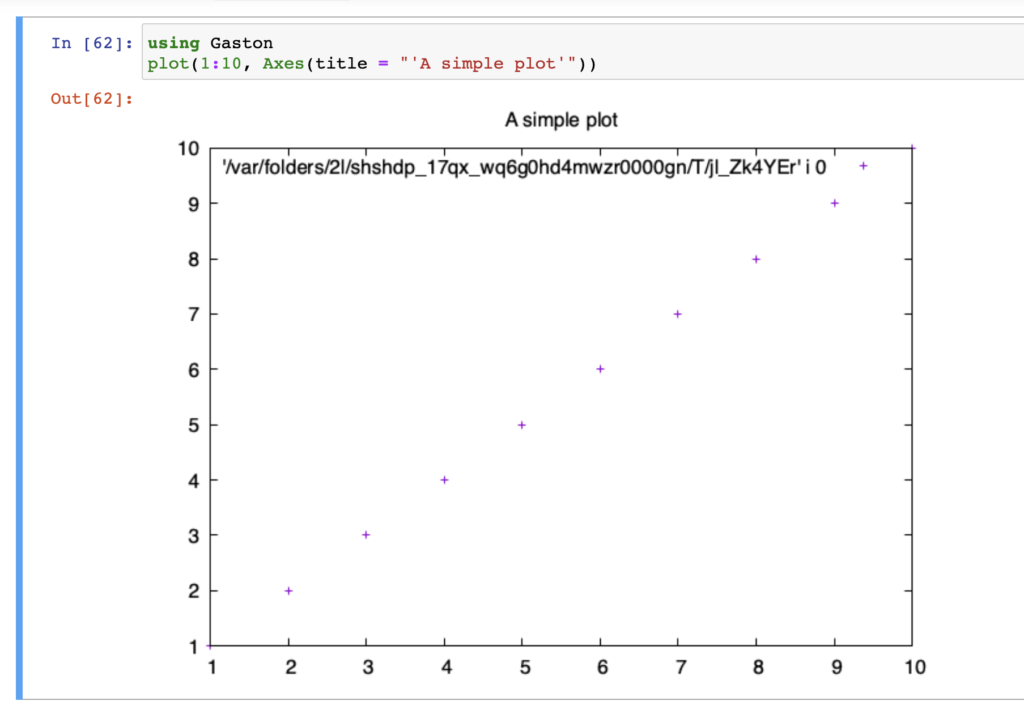
For some reason, the recommended ( in the Gaston documentation ) test line :
plot(1:10,title="A simple plot")did not work.
Creating first Gaston/Gnuplot project
Now, this is all nice, but it would be better to create specialized environments for particular kinds of projects to make it easier to manage the packages and dependencies. You can read about how I implemented it for my visualization projects in my next blog post.